Client-based studio project / AI product direction
Energy Transition System
A productized communication and decision-support concept that helps non-expert stakeholders understand the trade-offs behind nuclear energy in Australia's energy transition.
Product Manager framing
The brief was not the problem statement.
The initial interpretation was to promote nuclear power in Australia through a non-traditional media experience. I treated that as a hypothesis, clarified the audience and adoption constraints, and used stakeholder conversations to repeatedly reframe the product before committing the team to a solution.
Challenge the brief
Separate the client's commercial intention from the user's real information need and the policy reality.
Find reachable evidence
Use sustainability networks and environmental-sector interviews when direct policymaker research was impractical.
Reframe the value
Move from selling nuclear adoption to helping people compare energy choices and understand systemic trade-offs.
Choose the right medium
Prioritize a fast physical decision game, with a QR-linked Figma concept for users who wanted deeper exploration.
Research evidence
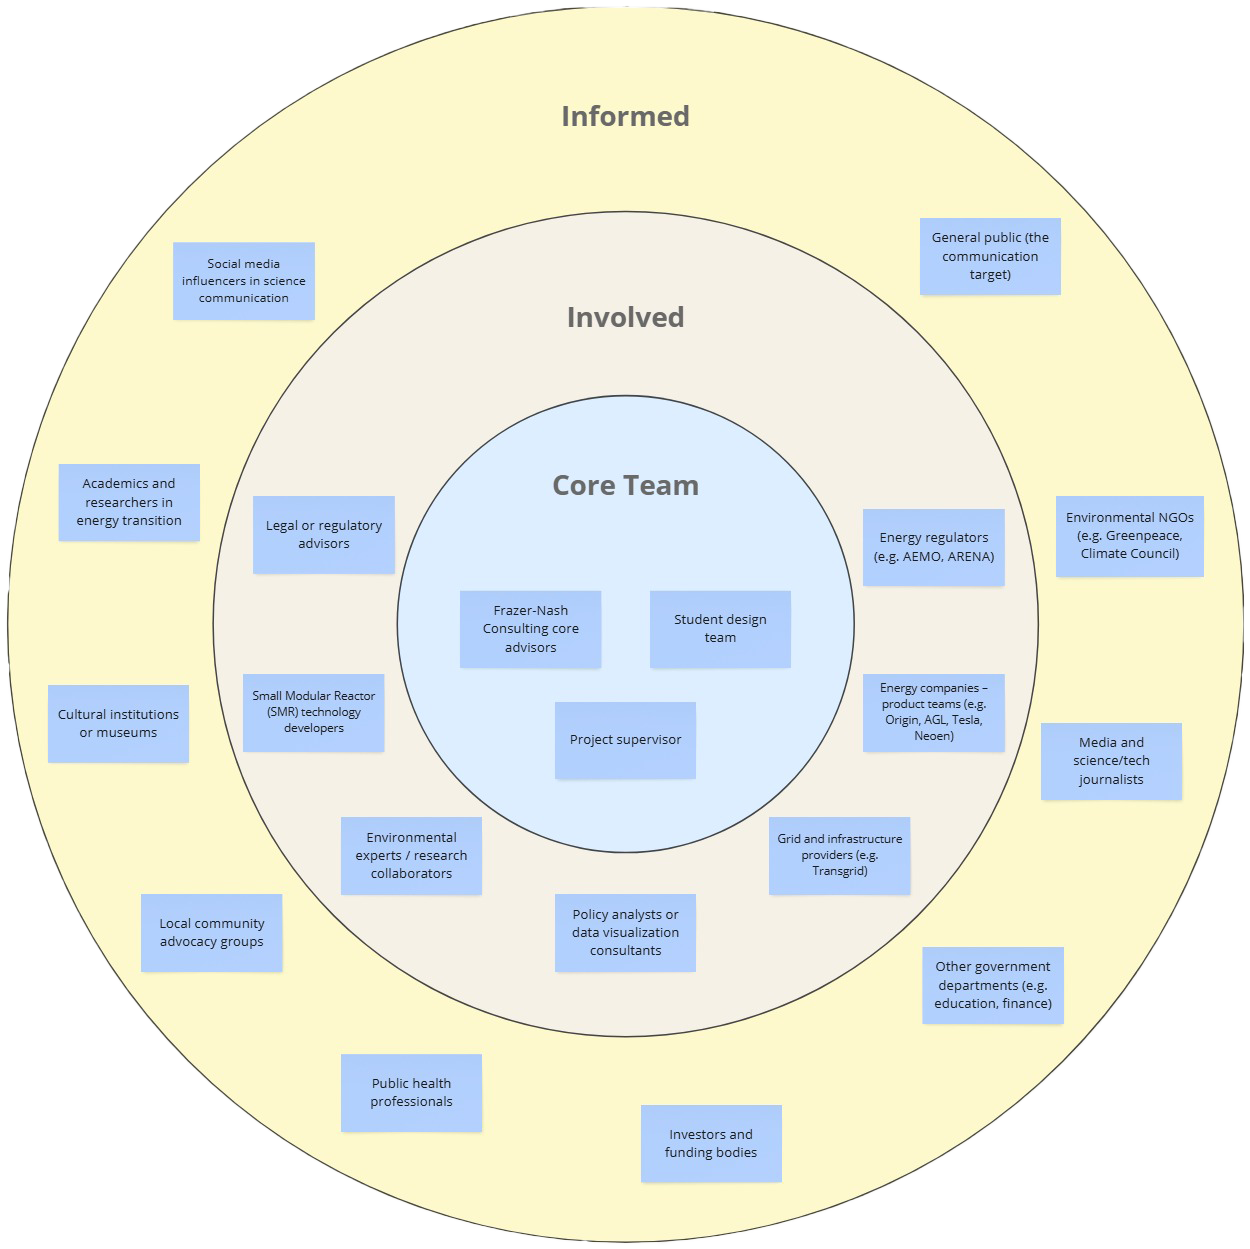
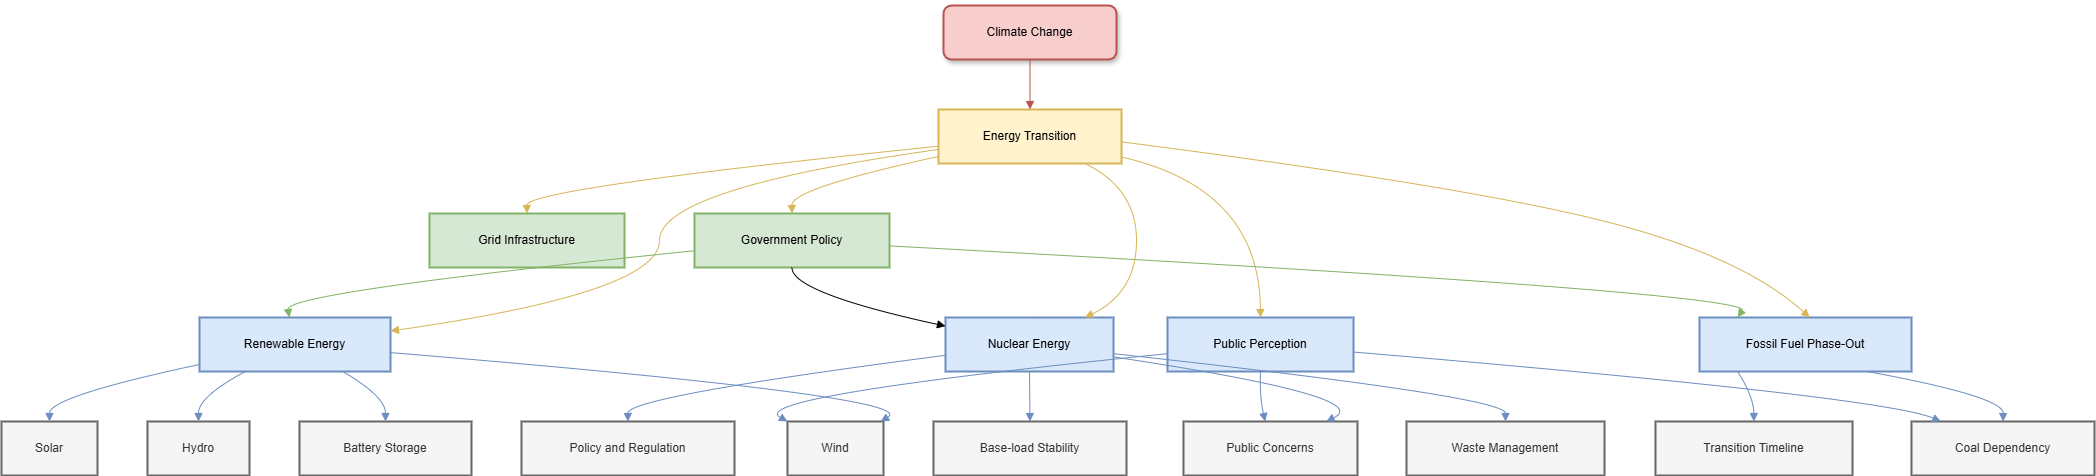
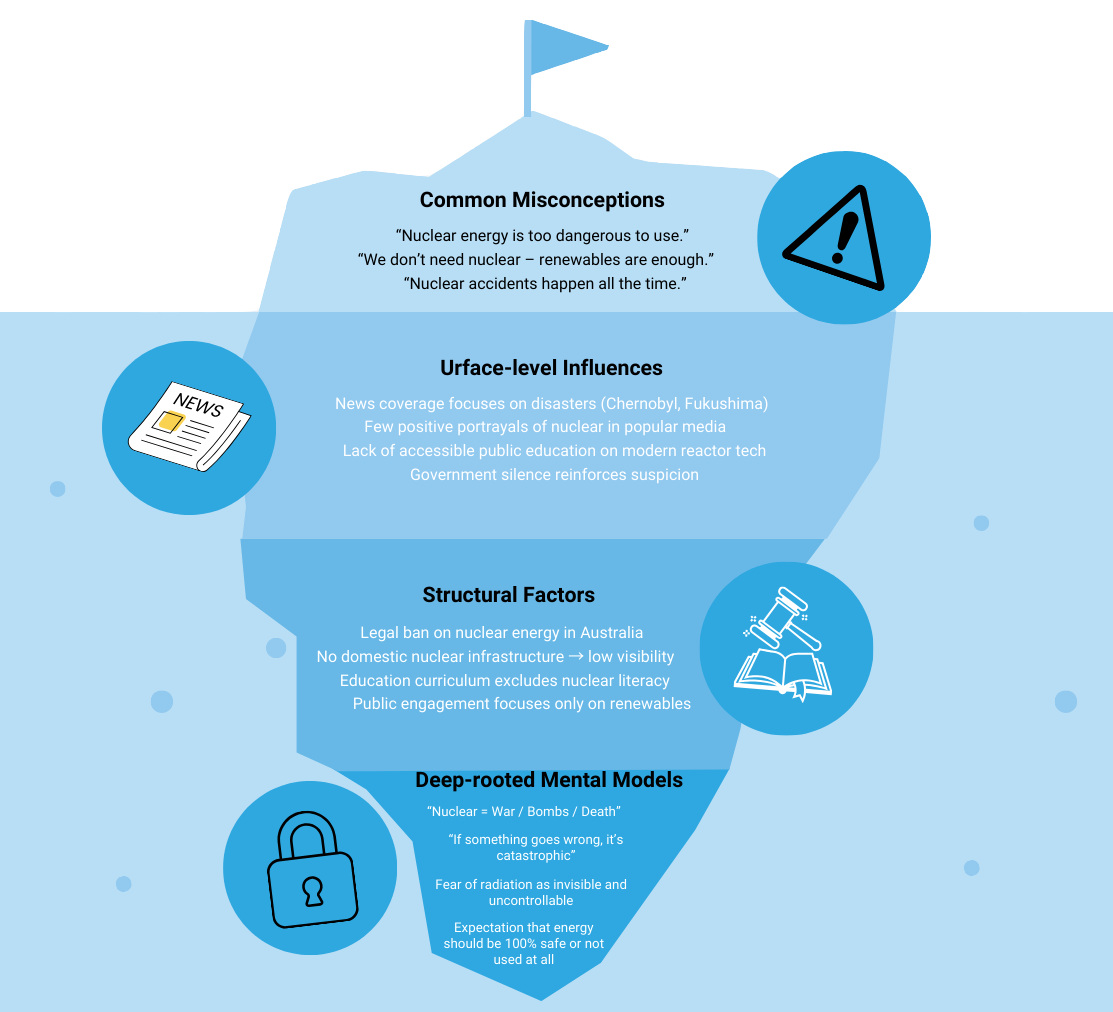
The maps are the product foundation.
These diagrams are not decorative process artifacts. They define the product's audience, system variables, hidden risks, and decision boundaries.
Product decision log
Four pivots made the concept more credible.
Each pivot changed the audience, value proposition, or delivery format. The direction was narrowed through feasibility evidence rather than polished around the first idea.
-
Start
Younger audiences
Build long-term nuclear awareness.
-
01 / Client
Policy audience
Focus on NSW decision-makers.
-
02 / Evidence
Feasibility reset
Accept that near-term adoption is unlikely.
-
03 / Value
Neutral comparison
Explain trade-offs across energy options.
-
04 / Format
Physical decision game
Deliver a fast session with an optional QR layer.
Initial hypothesis
Build long-term nuclear awareness with younger audiences.
Because energy attitudes form over time, I first proposed university students and younger audiences as an accessible starting point for a non-traditional media experience.
Client clarification
Shift from broad education to NSW policy influence.
Further client alignment revealed a stronger interest in communicating with NSW political decision-makers. I redirected stakeholder mapping toward policy, regulation, public trust, and institutional influence.
Feasibility evidence
Stop treating near-term nuclear adoption as a realistic outcome.
Direct access to policymakers was limited, so I used university sustainability networks to reach a senior NSW environmental-sector perspective. The research reinforced that legal, political, and social barriers made short-term adoption implausible.
Value proposition
Reframe the project as comparative energy decision support.
Instead of advocating one predetermined answer, the product would let users allocate an energy mix, encounter consequences, and compare nuclear with other technologies while giving the client a credible way to present its broader engineering expertise.
Delivery strategy
Replace a mobile-first concept with a rapid physical experience.
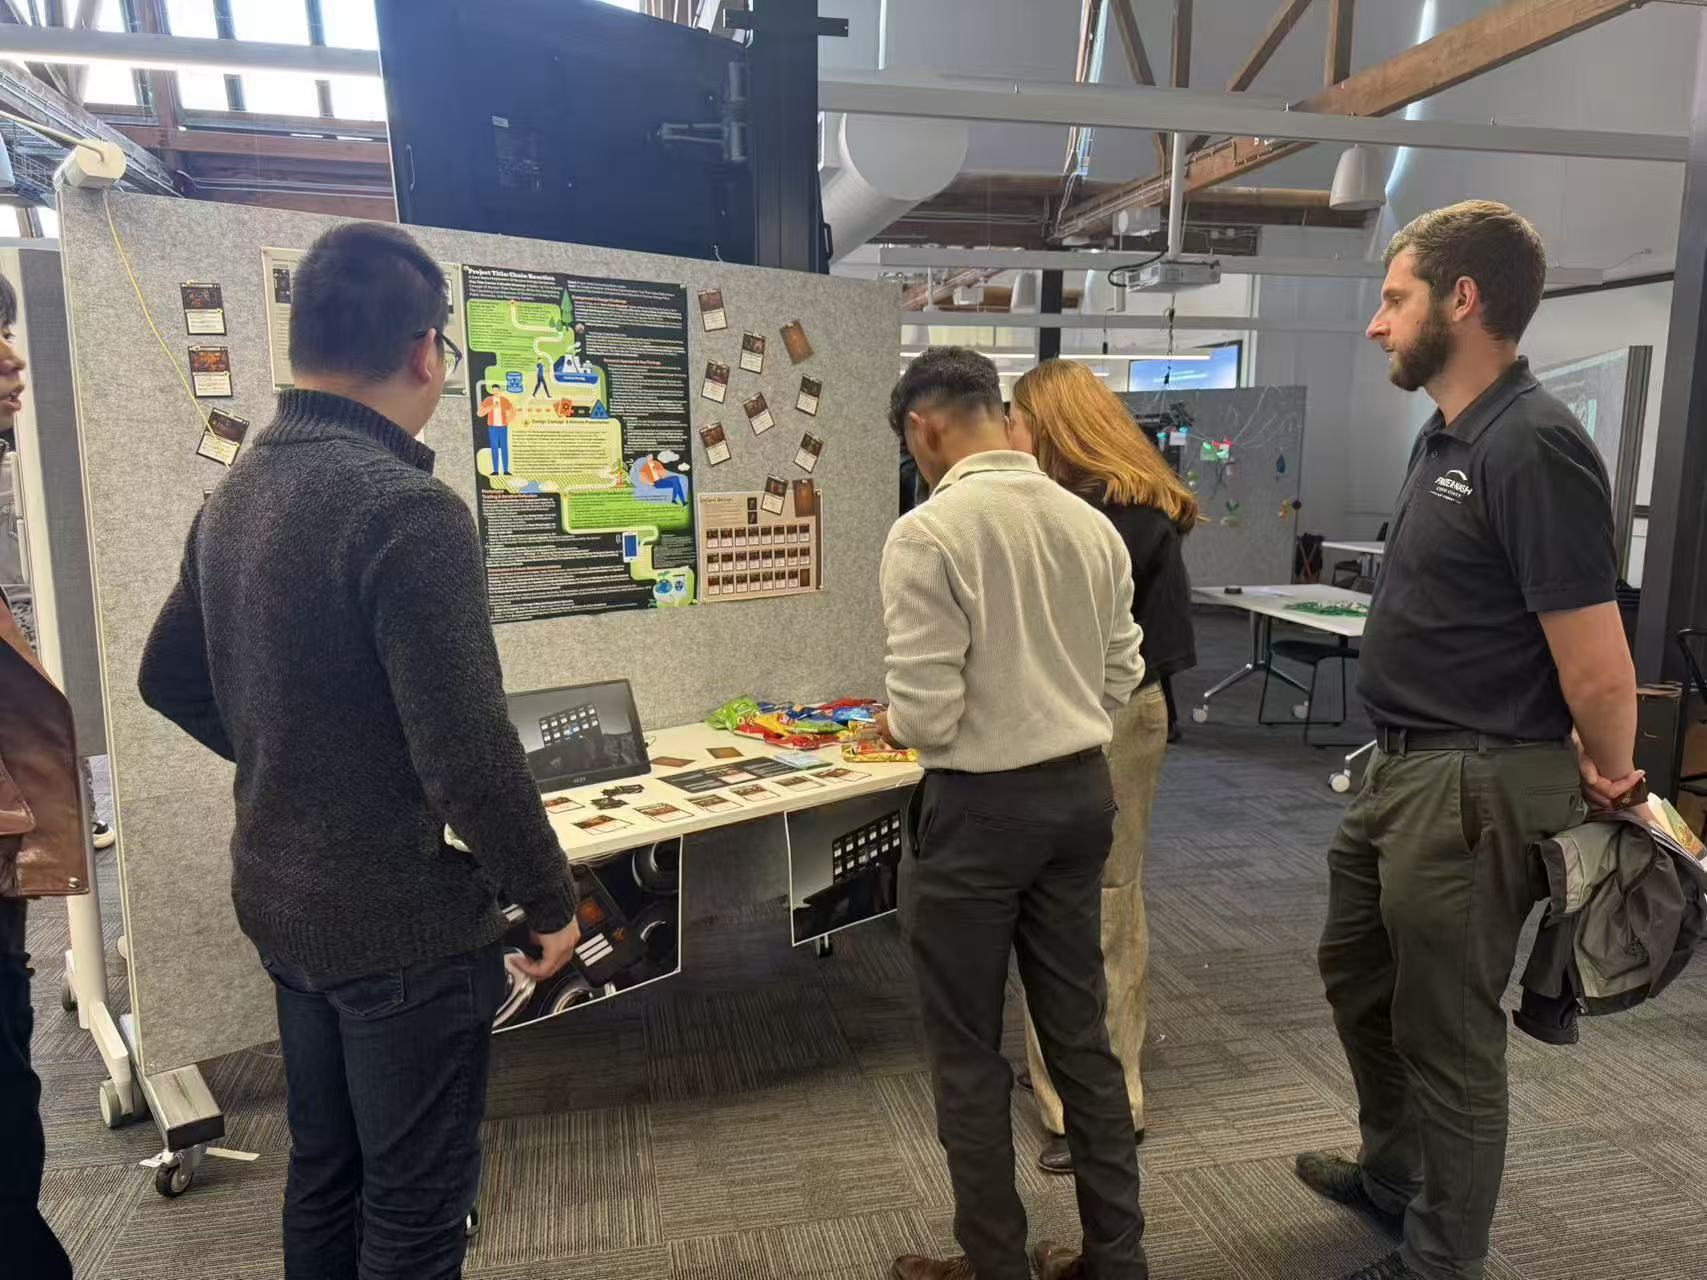
The client needed a format that could work in a short face-to-face session. I prioritized physical cards, a decision die, and immediate system feedback, then retained the Figma experience as an optional QR-linked deep dive.
Evidence to product definition
Research became product criteria.
I translated uncertain stakeholder input into a concrete interaction model and review criteria for the team. The success signals below were design targets, not claimed post-launch metrics.
Evidence
Product criterion
Design response
Review signal
Low likelihood of near-term nuclear adoption
Avoid presenting nuclear as the only correct outcome
Multiple energy types with visible benefits and trade-offs
Users can explain why no single energy mix solves every constraint
Policy audiences have limited time
Deliver the core insight within a short facilitated session
Physical cards, dice prompt, immediate variable feedback
A complete decision cycle can be demonstrated in minutes
Energy policy is abstract and interconnected
Make consequences visible without technical overload
Budget, trust, stability, environment, and feasibility indicators
Users can connect each choice with more than one system effect
Some users want deeper evidence
Support optional exploration without slowing the physical experience
QR-linked Figma flow for detailed scenarios and explanations
The physical journey remains complete without opening the digital layer
Product mechanism
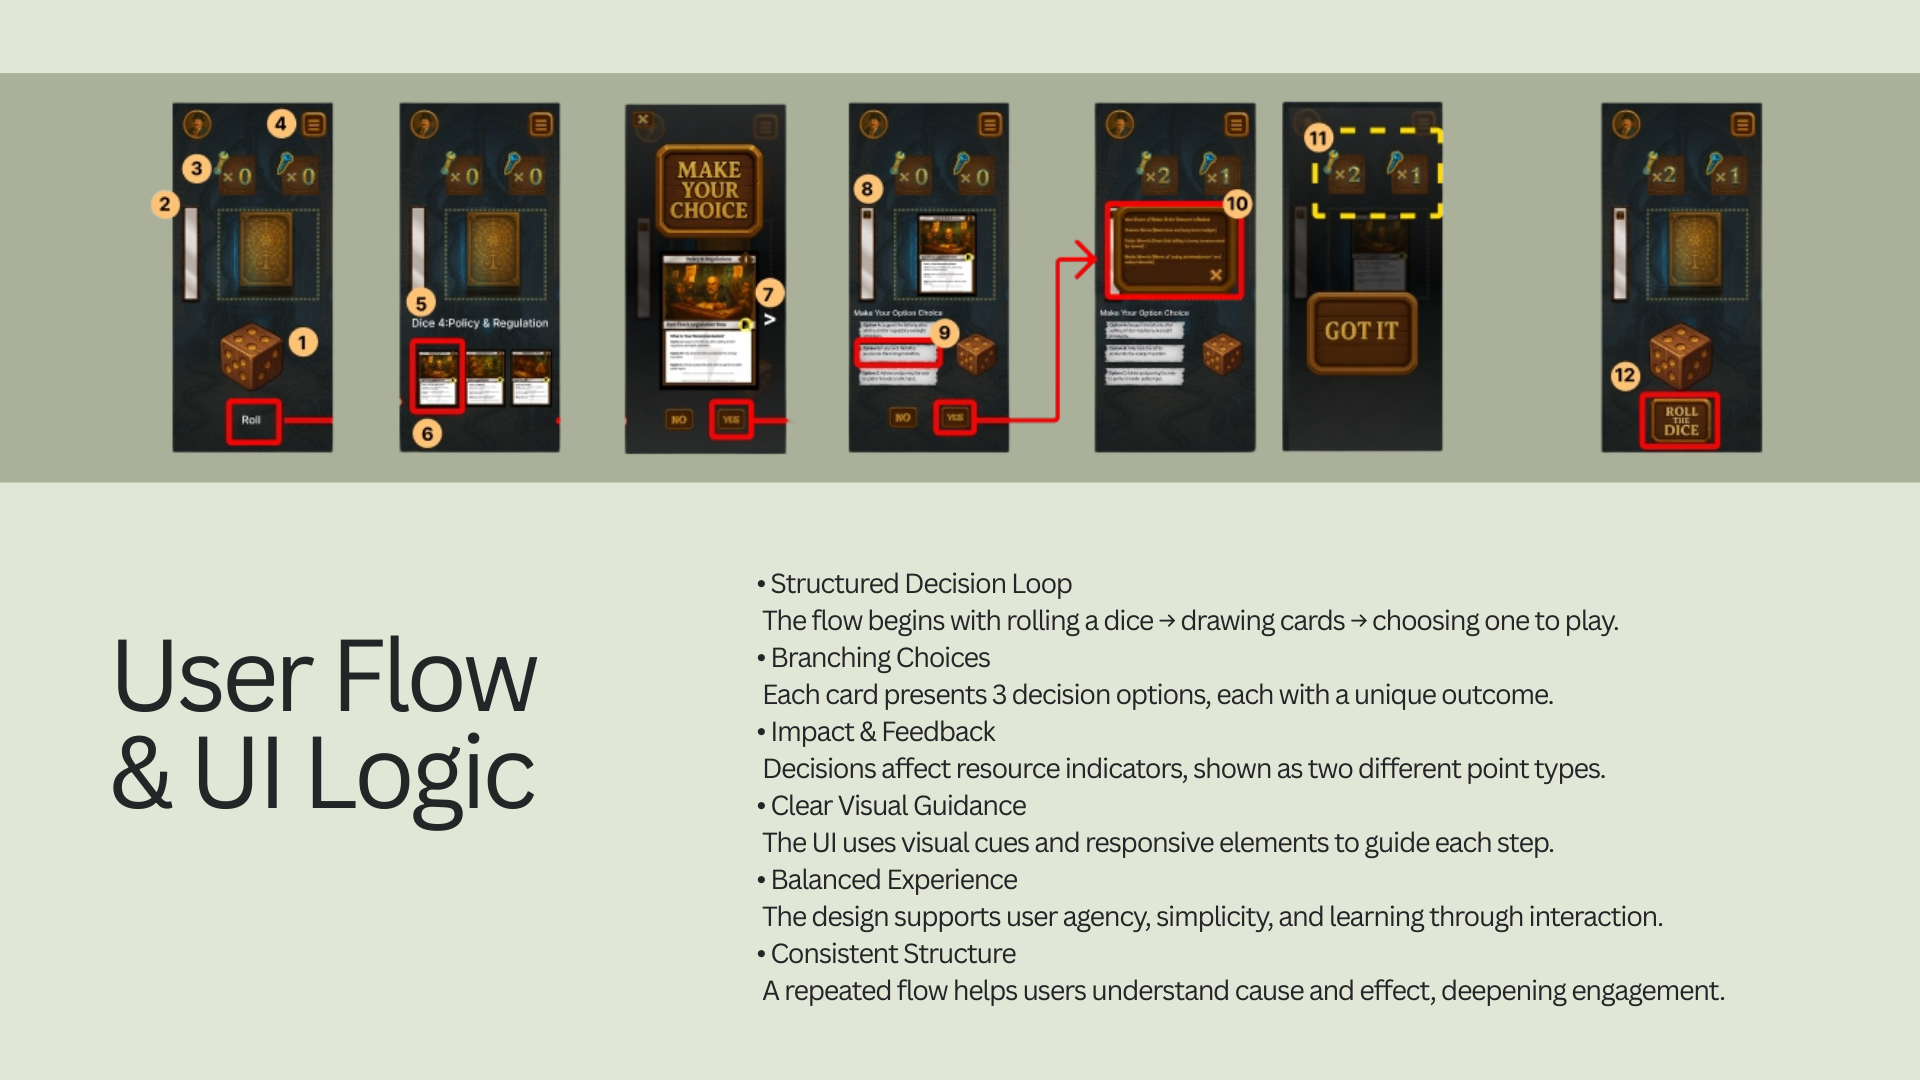
Decision cards turn complexity into interaction.
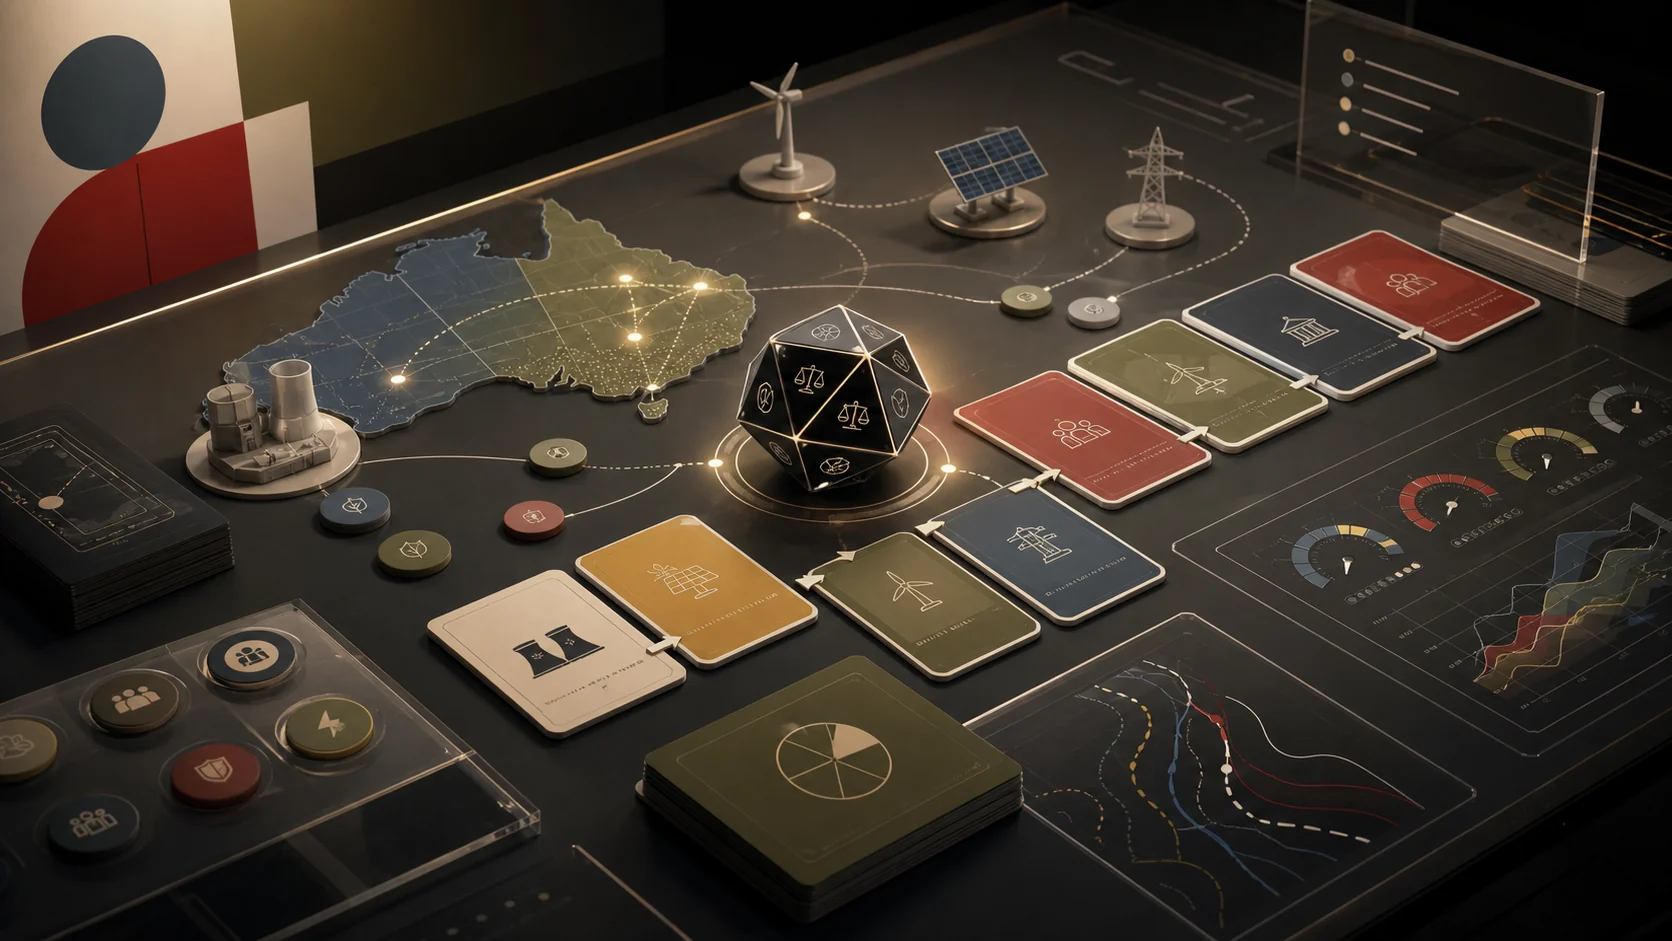
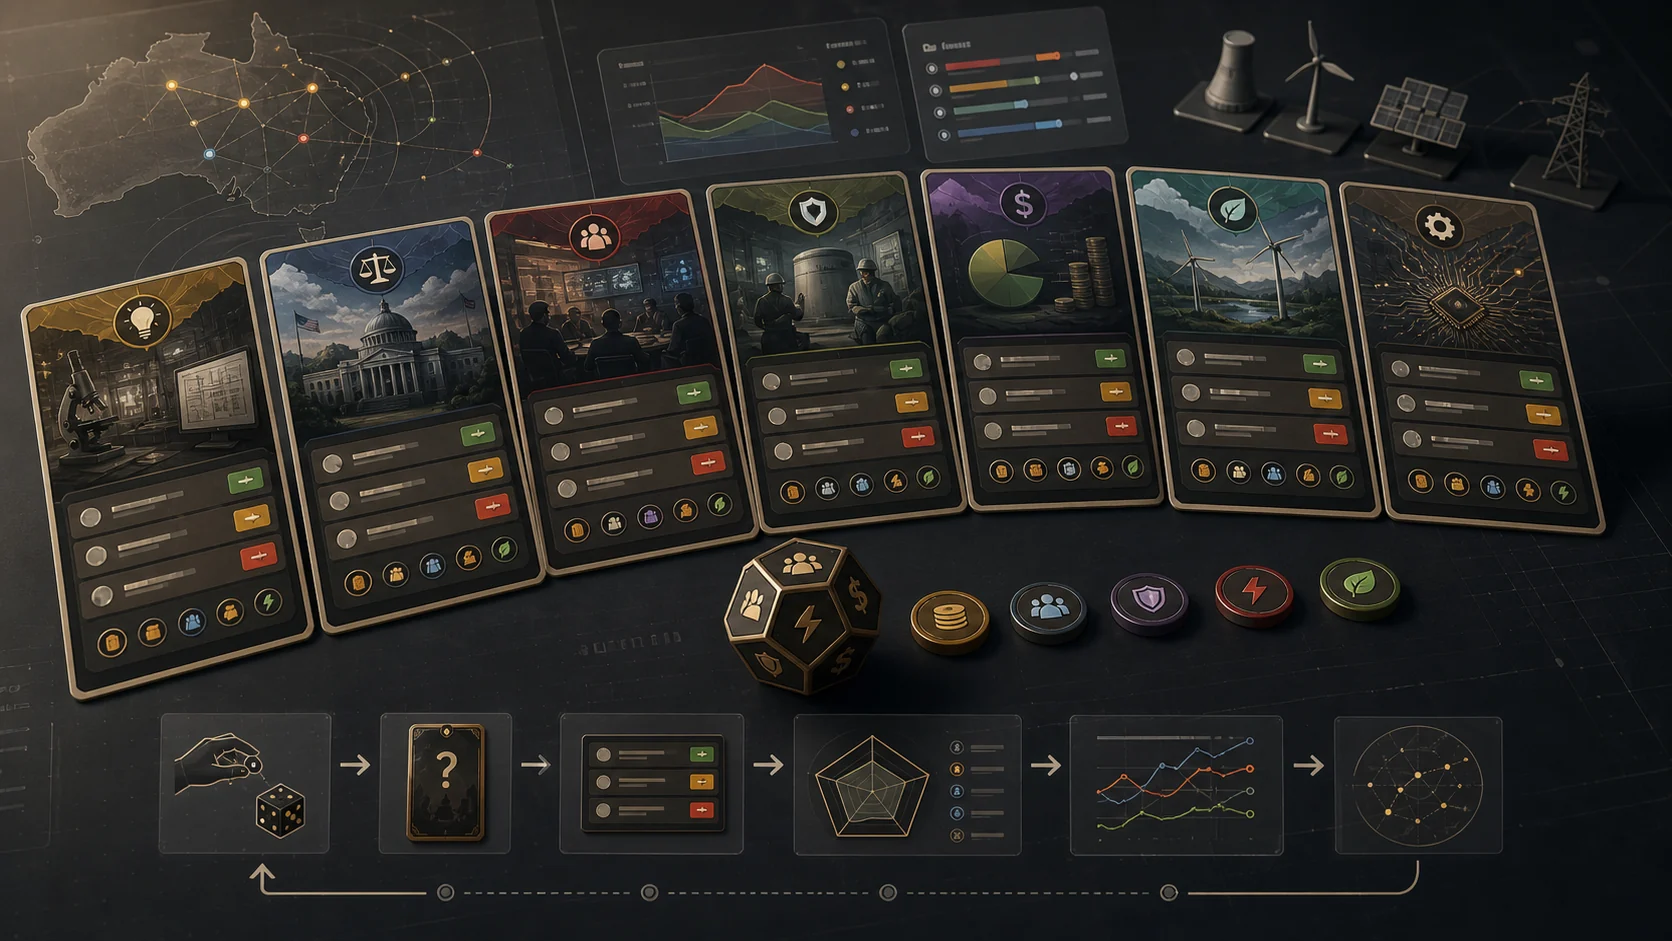
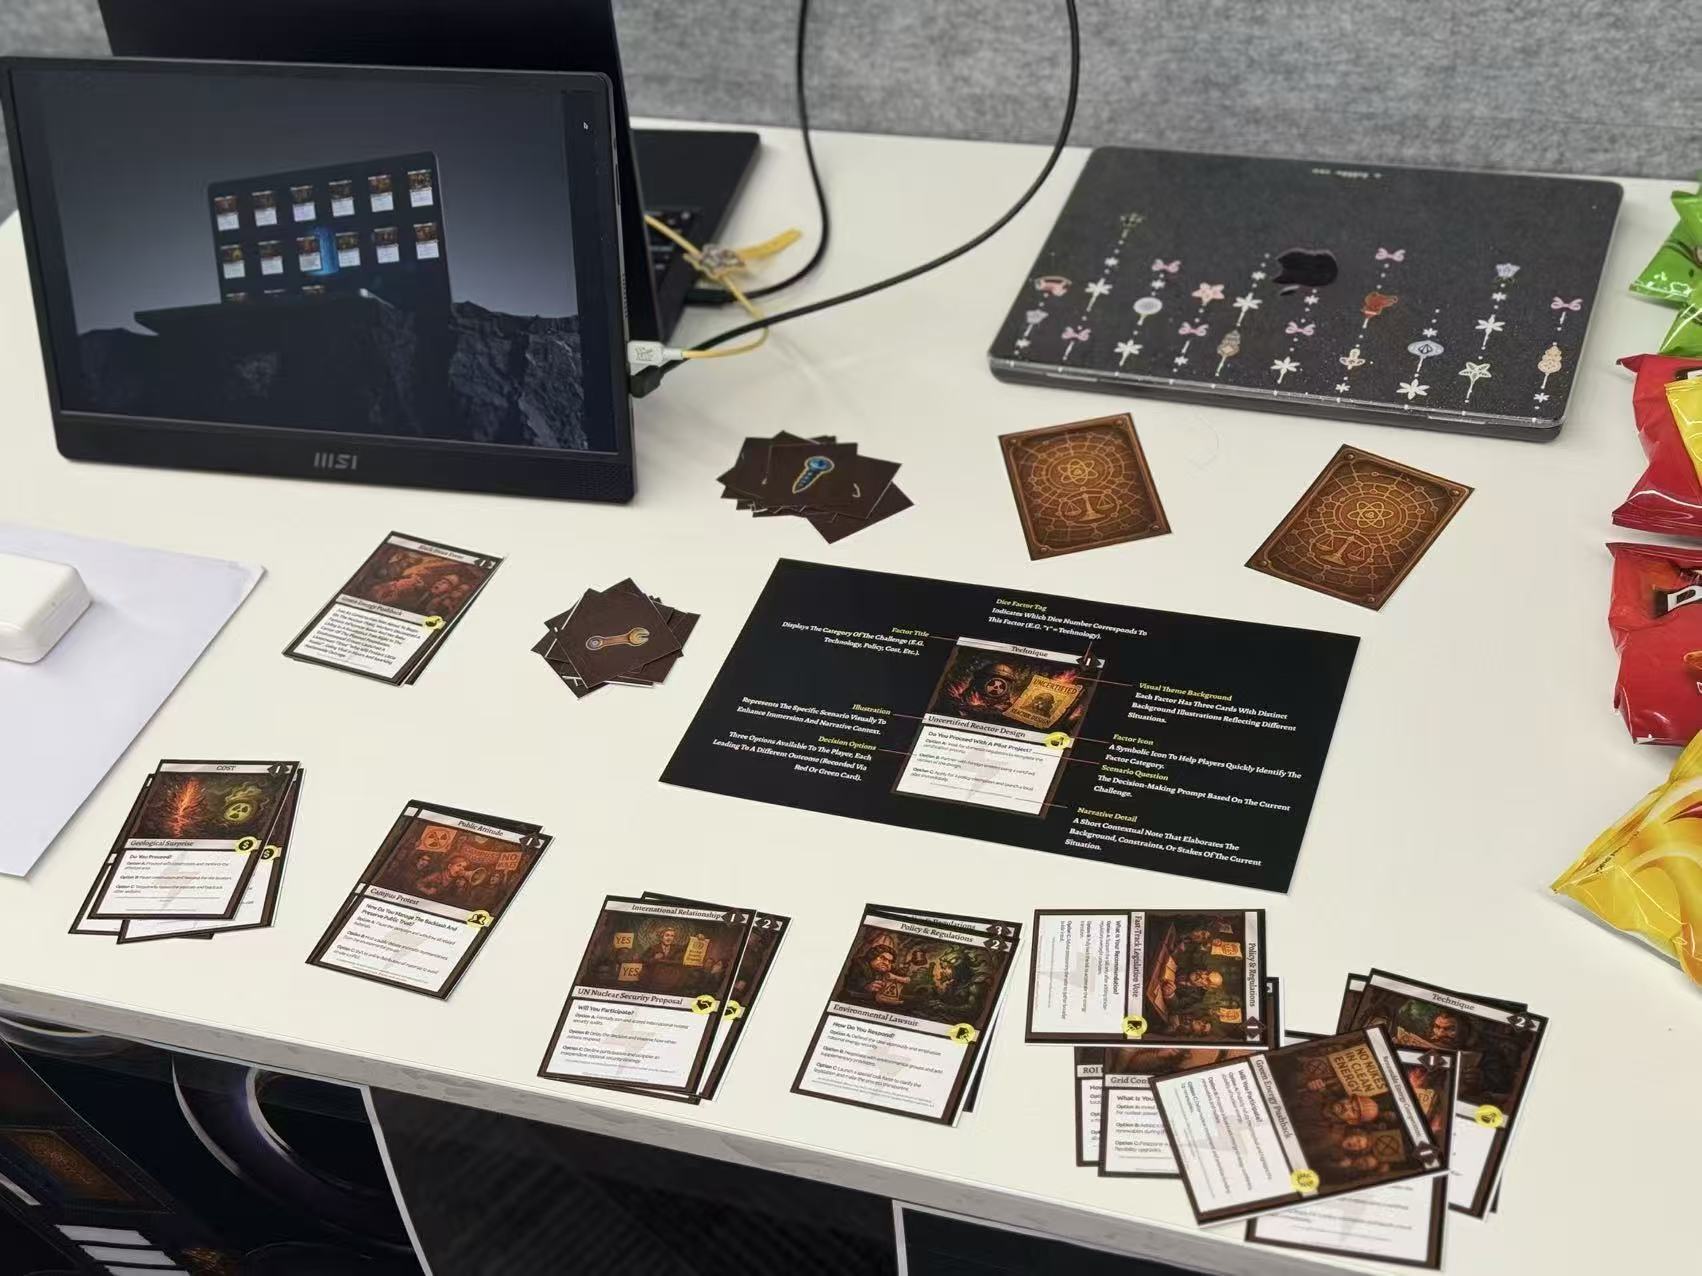
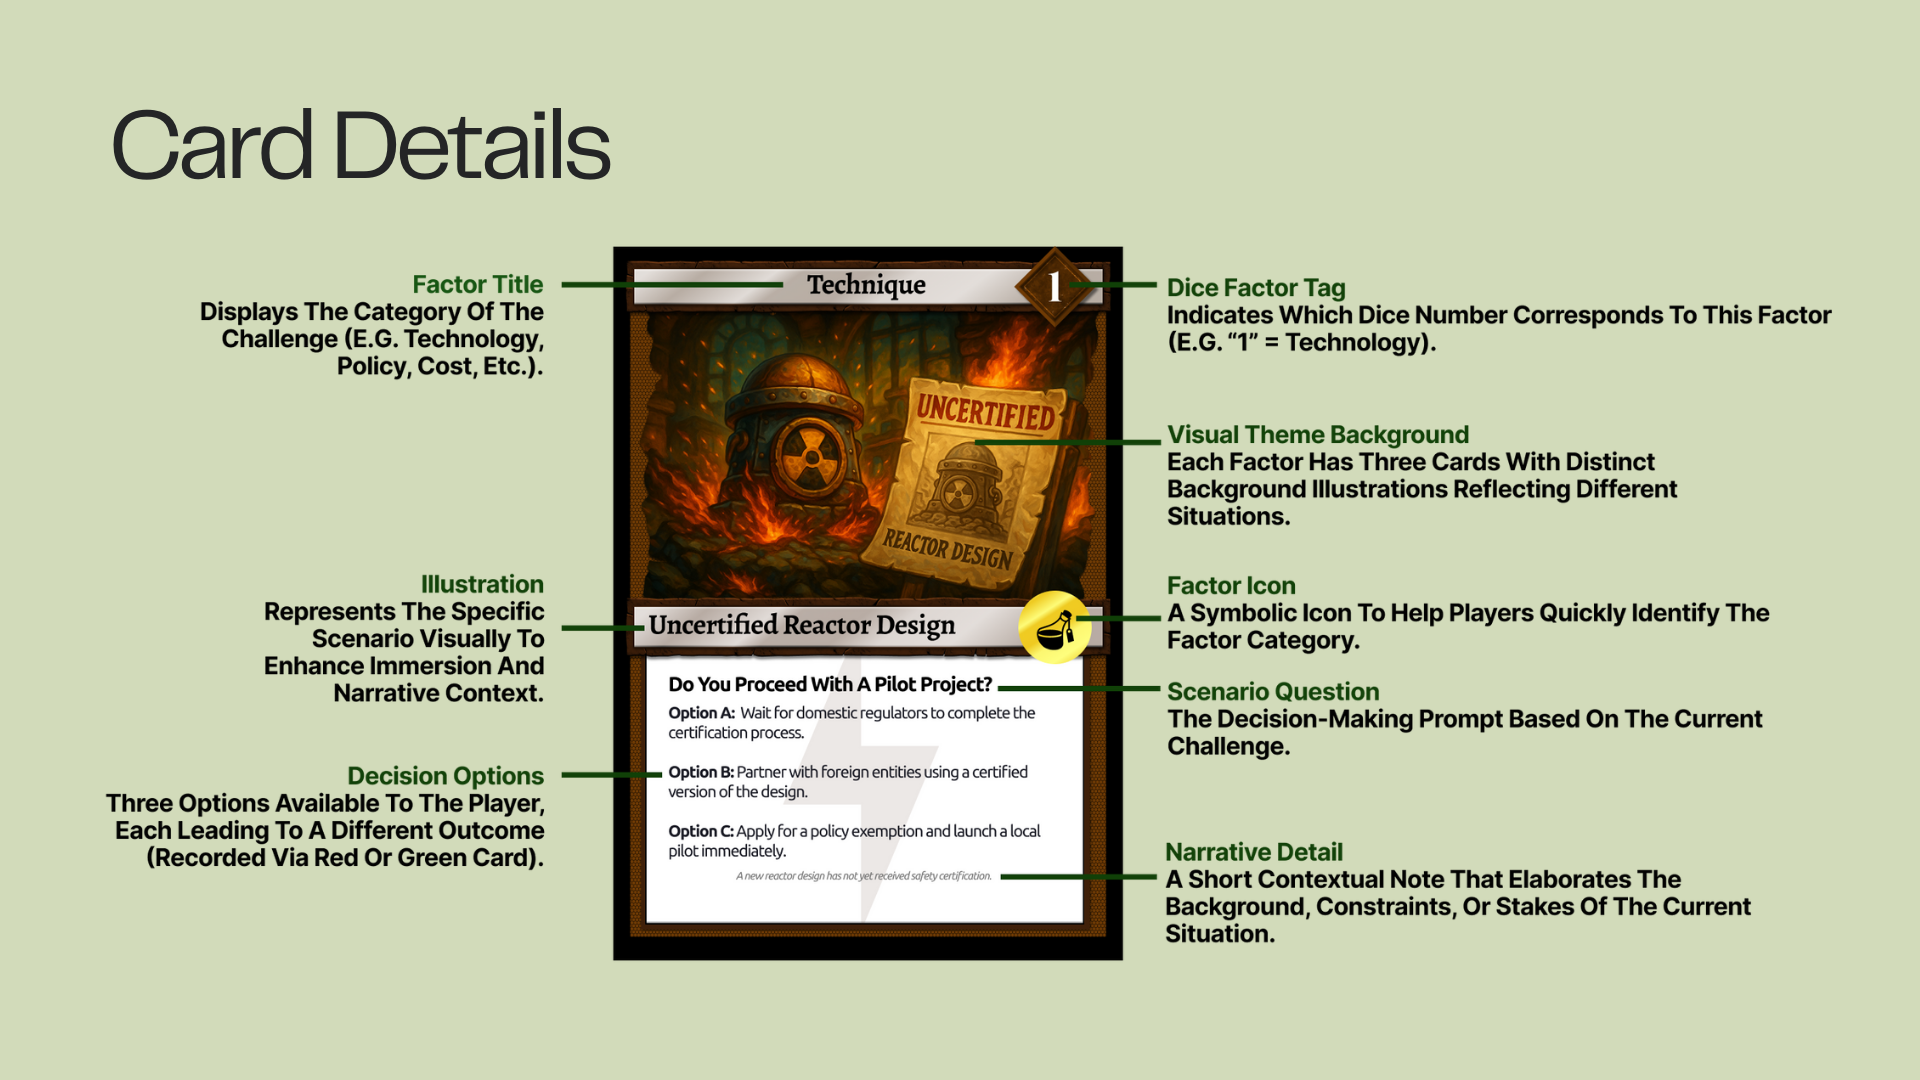
The card and dice mechanic transforms a policy debate into a repeated decision loop: roll a scenario, review a card, choose an option, update variables, and reflect on systemic consequences.
Delivery and ownership
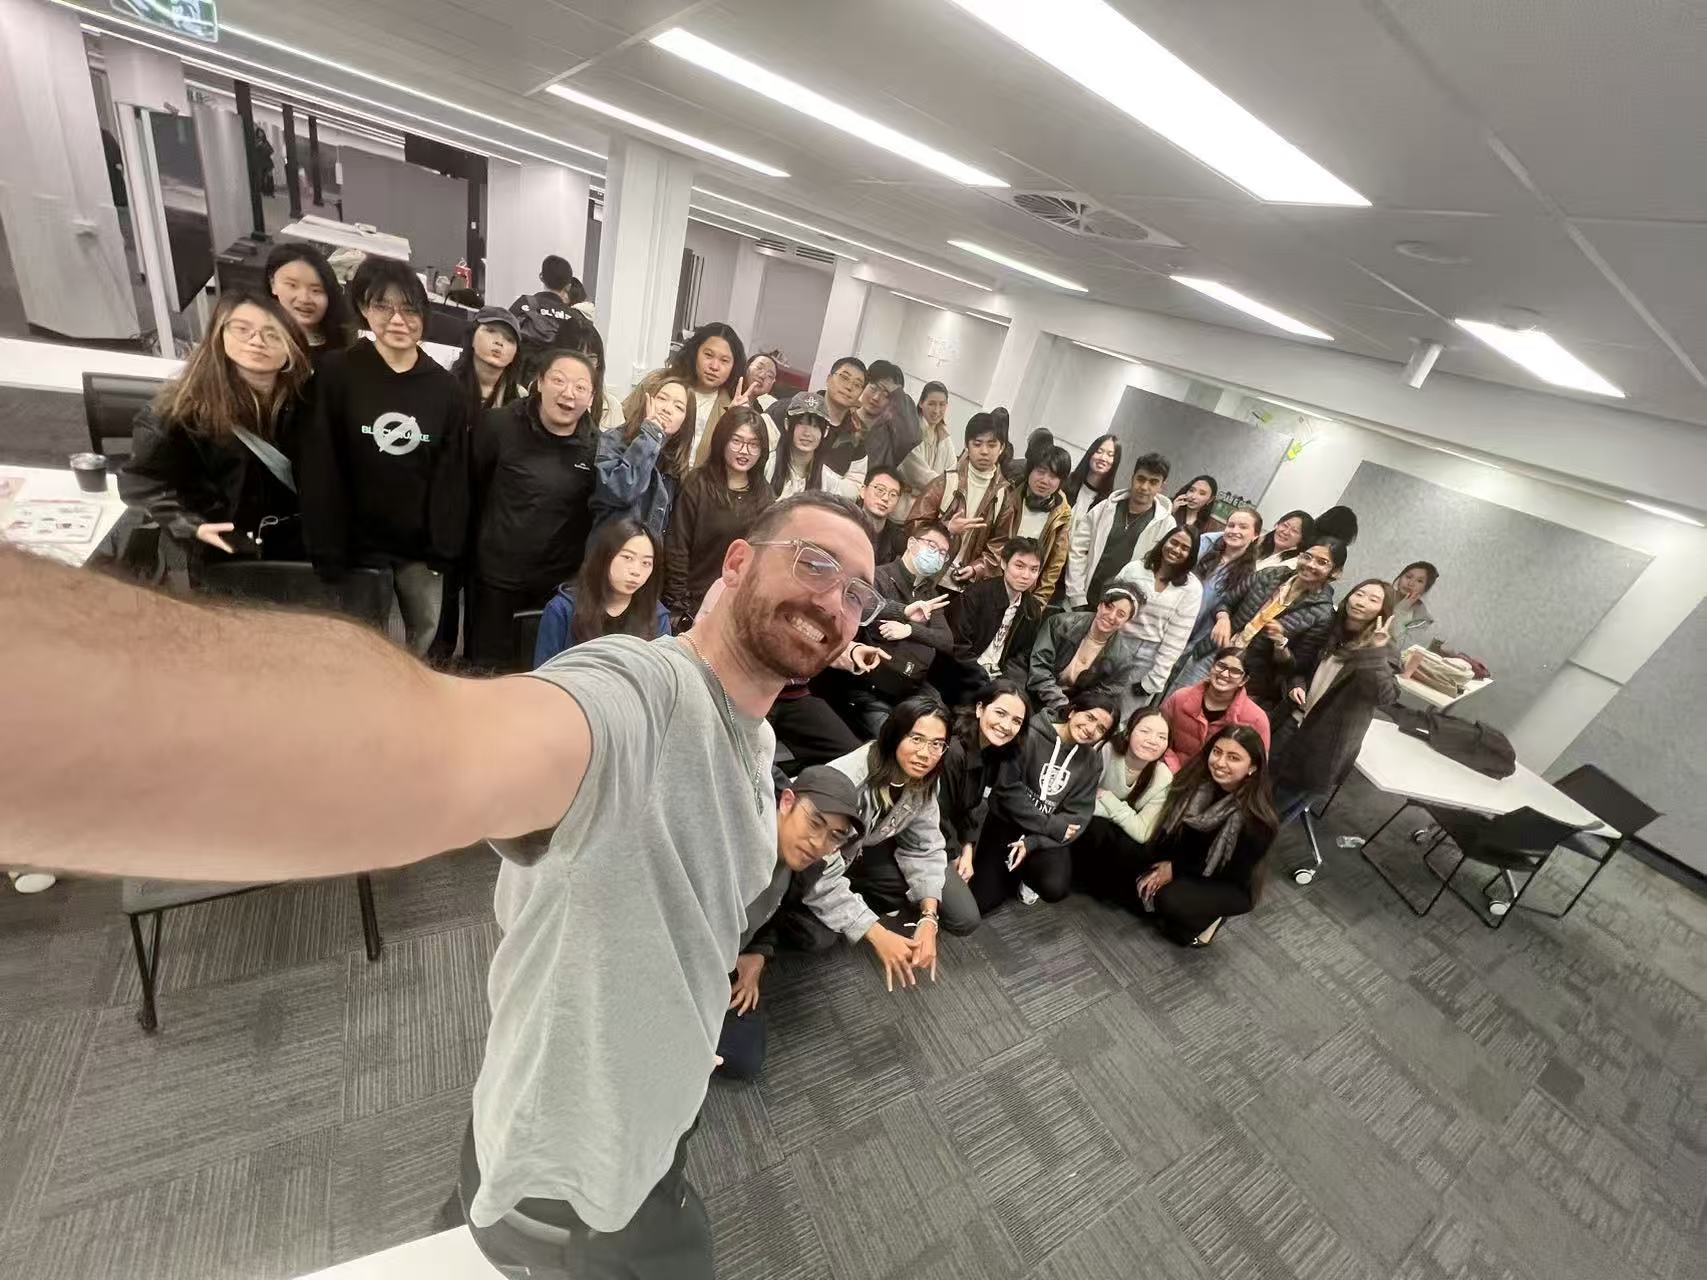
One product direction, coordinated across a five-person team.
Across approximately five months, I acted as the bridge between the client, studio lead, design work, and technical constraints. I maintained the product direction, converted discussions into requirements, sequenced team tasks, reviewed prototype consistency, contributed to Figma and implementation work, and packaged the concept for full client handoff and future adaptation.
Align
Clarify what the client intended, what evidence supported, and what the team could credibly deliver.
Specify
Turn stakeholder insights into product rules, required states, content structure, and prototype priorities.
Coordinate
Assign and review work across research, physical prototyping, technical support, and Figma production.
Transfer
Deliver the concept as adaptable client-owned material rather than claiming control over later implementation.
AI product extension
How this becomes an AI decision-support product.
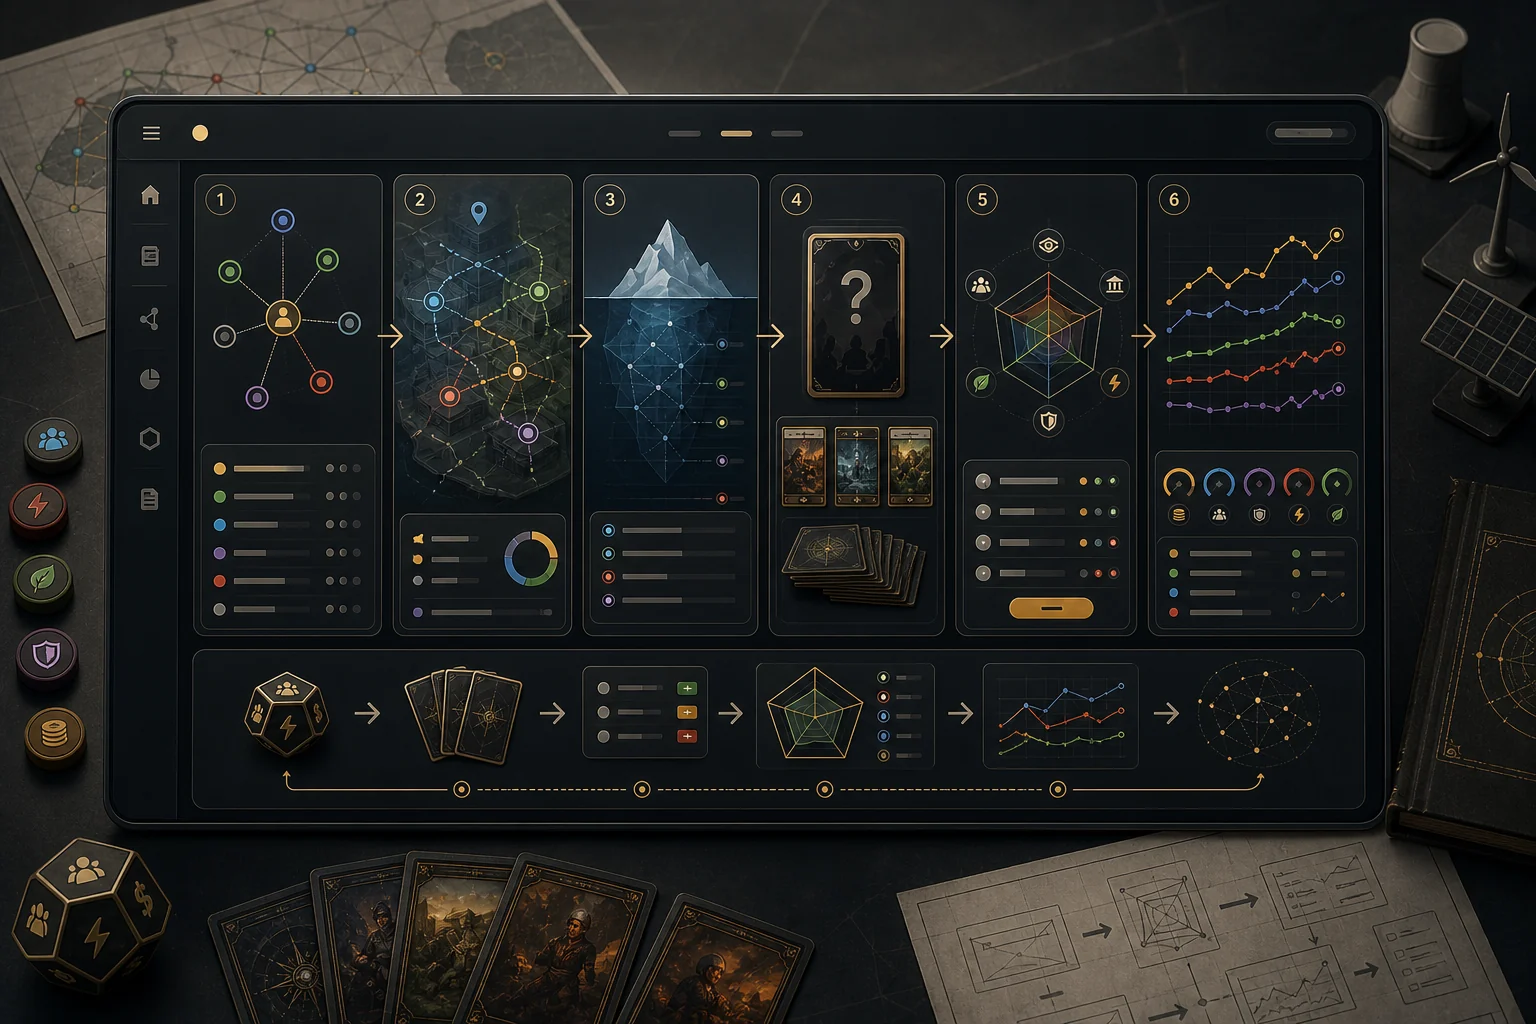
The AI layer is not added for decoration. It extends the original decision-card logic into a dashboard that can generate scenarios, explain trade-offs, and adapt views for policymakers, energy companies, and public audiences.
Research maps
Stakeholder, context, and iceberg diagrams provide the product's knowledge structure.
Scenario engine
Decision cards translate variables into user-facing choices and consequences.
System feedback
Variable changes make trade-offs visible without pretending there is one perfect answer.